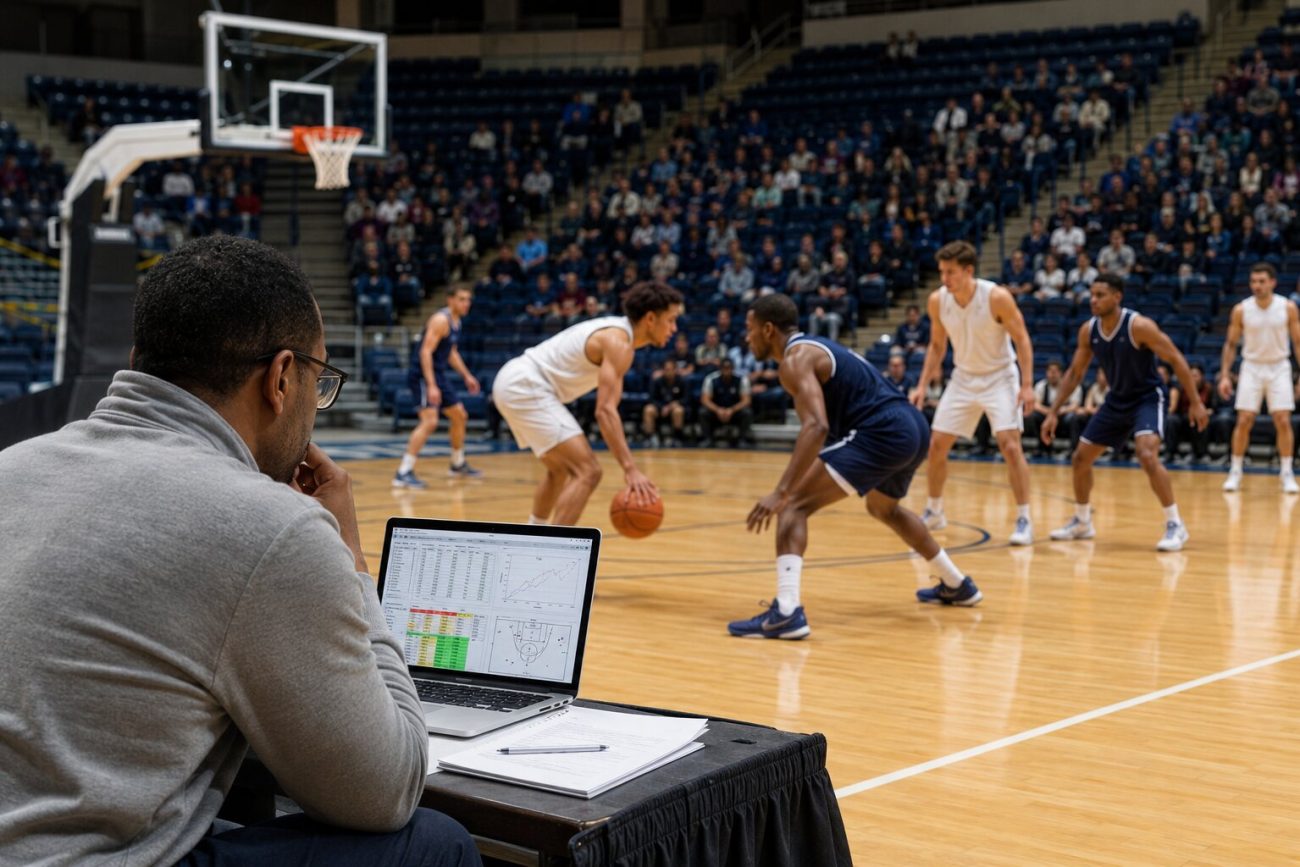
Basketball statistics answer specific questions, not every question. Points describe scoring volume; efficiency describes the cost of that volume; lineup and opponent context help explain why production occurred. Good analysis uses multiple measures and film.
Core measures
| Measure | Question it helps answer |
|---|---|
| Effective field-goal percentage | How efficiently were two- and three-point shots converted? |
| True shooting percentage | How efficient was scoring including free throws? |
| Turnover rate | How often did possessions end without a shot? |
| Usage estimate | How much offensive finishing responsibility did a player have? |
| Net rating | What was the scoring margin per 100 possessions? |
Why pace matters
A faster team creates more possessions, which can increase per-game points, rebounds, assists, and turnovers. Per-possession comparison is useful when teams or eras play at different speeds.
The lineup problem
A player’s numbers depend on teammates, spacing, defensive assignment, and role. On-off statistics can identify patterns but are affected by substitute groups, opponent strength, and sample size.
Small samples mislead
Five hot games do not establish a new shooting level. Check attempt volume, shot quality, previous seasons, and whether the role changed. Playoff samples are especially sensitive to one opponent and matchup.
A responsible workflow
- Define the question.
- Select a statistic designed for that question.
- Check minutes, possessions, and sample size.
- Add role, lineup, and opponent context.
- Review film for mechanisms the number cannot show.
Sources
Metrics from different providers may use different formulas; read the definition before comparing.
